
Seeing is Believing: How Code Makes Statistics Click
Original headline: Simulating and Visualising the Central Limit Theorem — hackaday.com
More in Semiconductor and chip news
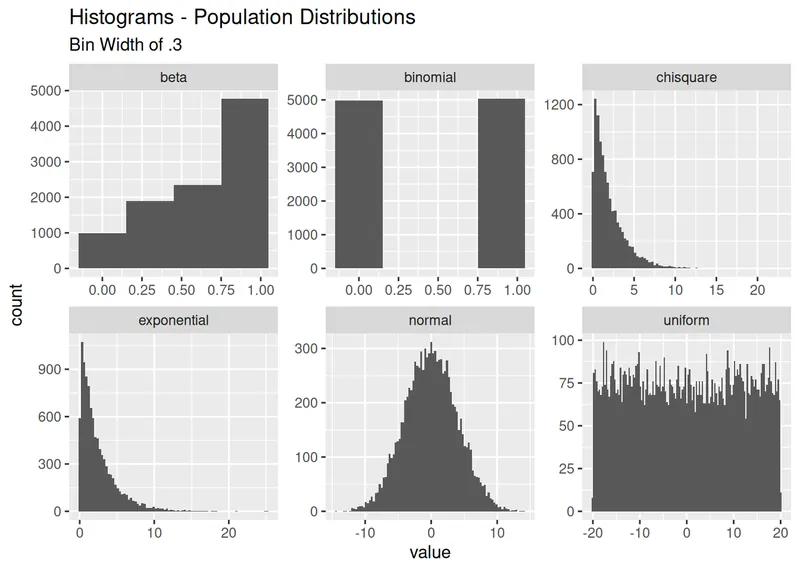
A developer has tackled one of statistics' most powerful yet abstract concepts—the Central Limit Theorem (CLT)—by creating code samples and visualizations to make it easier to understand. The CLT states that if you repeatedly take samples from any population and calculate their means, the distribution of those means will always tend toward a normal bell curve, provided you have enough samples (typically over 30). This principle is fundamental to fields like engineering, finance, and data science, but its mathematical proofs can be dense and intimidating.
The project uses programming to simulate this process, generating random data and plotting the resulting distributions to show the theorem in action visually. This approach helps engineers and data professionals build a more intuitive grasp of why statistical methods work, moving beyond dry formulas to practical understanding. Whether you're analyzing A/B test results or modeling system performance, seeing the CLT demonstrated through code can turn a theoretical hurdle into a usable tool for real-world problem-solving.
Read the original at hackaday.com
Satirical commentary on real tech news, summarised with AI. Read the original source for the facts. How ZeroDaily works